|
I have been involved in many projects ranging from multiyear system implementations to short term projects involving external consultants. The biggest hurdle I always see is communicating the ongoing progress of those projects with the team.
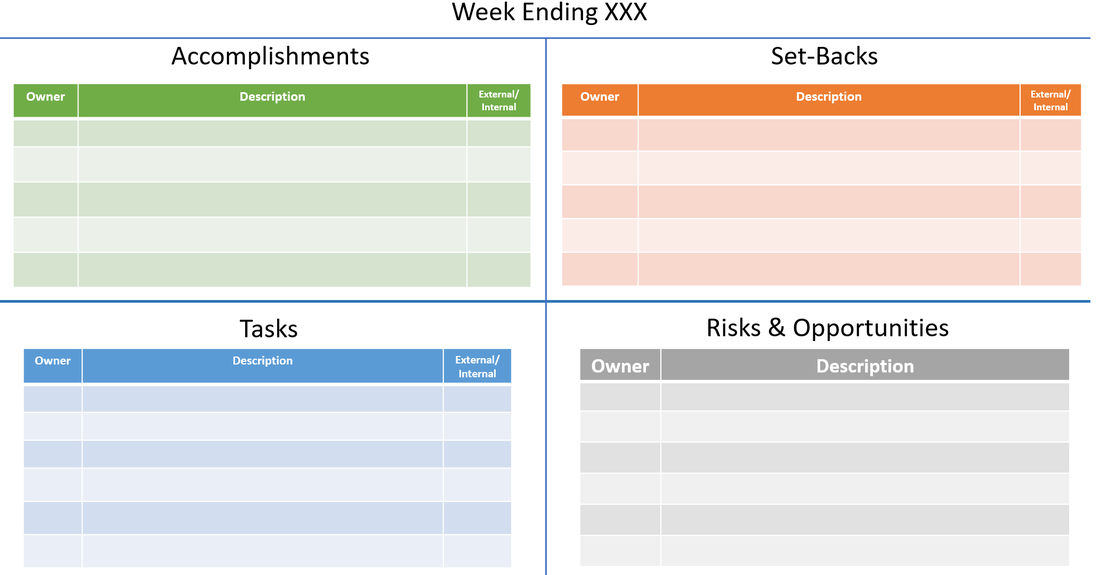 Now to clarify: this is NOT to replace a full project schedule with hundreds of tasks, milestones, predecessors, etc. It is more of a short term project management tool of getting team members together to understand the current state of the project.
This format works SURPRISINGLY great for all parties involved. It has the benefits of:
Tips to implement my ASTRO template:
As a public company, you disclose A LOT of information. As a CPA, I ironically HATE that I have to disclose some information to the public, because that info is usually used to criticize management about SHORT TERM performance. I believe in LONG TERM results and strategy. So it begs the question: what long term KPI's do companies share. As a former AB-Inbev employee (I loved working there while I was in STL) I always wondered how our core business was doing: selling beer! Well I decided to look it up now by going back to 9 years of Financial statements for AB. No where in the Annual Financial report does it show a trend of volume, plus it would be impossible to try to compare apples to apples with all the acquisitions they do every year. HOWEVER, there is way: you simple look at each Annual Report year by year and record their "Organic volume of Year over Year comparison." Combine all 9 reports and you get the following for North America (Canada and US) 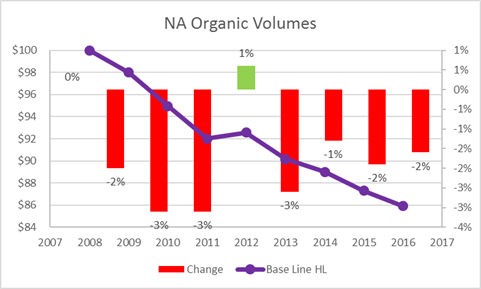 Summary:
- Volumes consistently are down 2-3% a year.. however not as bad as Europe which is more like 4-6% decline. - Cumulatively AB is down 15% North America Volume since 2008. It is the equivalent of producing 100 barrels of beer in 2008 and now producing 85 barrels. Is this bad? Hard to say. Yes they are producing A LOT LESS BEER yet they are bigger than ever. From a short term financial perspective, they are actually doing great because they have been able to raise prices(price), sell higher margin products(mix) and of course cut overhead and production costs like no other. This is why their EBITDA margins are industry leading: 36% at $16.5 billion in 2016! Amazon announced their top 20 "short list" of locations. New media seem to be guessing DC and NYC are top contenders since each metro area had 3 separate cities. It is pretty obvious though the reason they did this: To extract out as much monetary incentives for each city to pit out against each other. Amazon was smart too because each of the 6 cities (including philly as NYC) are in all different states.
I stick too my original list that DC/NYC/BOS/PHL will NOT be selected assuming one of these cities doesn't basically pay for the entire move through tax incentives. Another city that I considered, but didnt put as a top 5 was Atlanta. https://techcrunch.com/2018/01/22/new-study-predicts-atlanta-has-best-shot-at-becoming-amazons-hq2/ I mean yes, it makes sense from raw inputs and has the US largest airport, I just dont see it as a long term strategic "game changing" city when you compare it to similar cities that are on the list like Dallas. As far my top 5: I am going to say all of my 4 made it besides STL which I added on just because of my bias from living there and stated it was a long shot. I say all mine made it, but really I just need to change Cincinnati to Columbus and Charlotte to Raleigh. I blame my minor error by overlooking where the State Capital (tax incentives *cough cough*) are located as well as where all the University talent is. I stand by my order with Denver #1, Austin #2, Raleigh #2, Columbus #4. If I was a betting man, I would totally throw in Dallas to replace Columbus. A former colleague of mine was recently offered a job with Amazon in Seattle. Needless to say, they were very excited, but after doing a little more research they realized that even though the pay was decent, Seattle's housing stock was a mess. Shortage of houses and apartments have lead to a spike in home prices. Those that are affordable are tear downs or are a 1+ hour commute to downtown. This friend coming from NYC realized there was $0 cost of living benefit moving to Seattle and would actually be making less when factoring in commuting time. After rejecting the offer and keeping the lines of communication open for future possibilities, amazon announced the intention to build Amazon HQ2… interesting. Fun fact: 1,100 people are moving to Seattle A WEEK! This includes surrounding cities such as Redmond, Bellevue, etc. Lets start by eliminating the cities that think they can win, but obviously will never land the HQ2 purely due to cost of living: The Northeast and California. $100k average annual salary does not impress potential employees in these areas. Do not get me wrong, $100k is nice, but not amazing when you compare it to other locations in the United States. Having lived and traveled all over the united states, I am going to throw my top 5 predictions in no particular order. (Final order is listed at end of post)
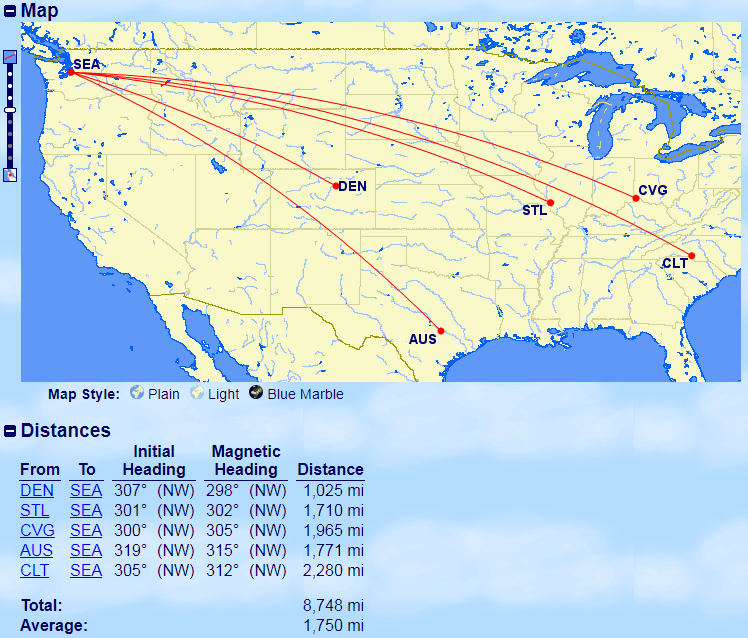 Take Away: Denver: Most people think of Denver as a West Coast city. But when you map it out, it is a sizable distance from Seattle which adds to the validity that Denver is a top choice as it is not too close to HQ1. Charlotte and Cincinnati: On the opposite spectrum you have two East Coast locations which guarantees one thing: Your company now has a full 3 hours of additional working time during the day due to the time differences. Austin and St. Louis: The two central locations are almost exactly the same distance from Seattle. However the map really does show how isolated Austin is from the rest of the country…smack dab in the middle of Texas. Unique Qualities: Austin, TX on paper seems too small to host amazon. They would run into similar growth problems that Seattle has experienced both with talent and housing. However, what is one's loss is another gain and that is DELL. Dell is Austin's largest non-govt employer in Austin and lately has not been doing well. If we expect Dell to transition into the declining phase of corporate life, amazon would easily be able to absorb that talent over time. Also considering amazon just spent $14 Billion on WholeFoods who is based in Austin; that is a pretty solid reason to expand that investment. Not to mention Austin has some great PR going for itself, seems everyone wants to live there even though they never even visited there. And one more thing… no state income tax for employees, score! St. Louis, MO Back in the very early 1900's St. Louis was the 4th largest city in America. Fast forward 110 years and it is not considered a fly over city. However, STL still has some very large corporations based there and most importantly has the infrastructure to easily host Amazon HQ2. Amazon could have the pick of the litter from having a downtown mecca urban office space, to a river front campus to the standard suburban park oasis. In addition, St. Louis and Denver have the largest MSA populations on this top 5 list. Ironically the largest hurdle that St. Louis has is itself. Due to the city/county boundaries, St. Louis is consistently ranked as one of the highest crime ridden cities in America. The problem is that the stats only count a tiny portion of St. Louis which is the City of St. Louis which is TINY. It is like only taking the statistics of the BRONX in New York City and making that the representation of all of New York City. Regardless, St. Louis has the opposite problem of Austin and Denver; HORRIBLE PR. Cincinnati, OH What most people do not know is that this area already has a large amazon presence. From Warehouses to the home base of Amazon Air's logistics hub(CVG). Cincinnati has enough land for whatever amazon would like and their downtown is "healthy", but could be better. There really is not that much else to say which could be bad or good. Overall it is just a solid and safe choice, but Amazon may want to be trying to create something rather than "rebuilding" another rust belt city. Denver, CO. You have arrived at the Mile High City, both figurative and factual. It is probably good that marijuana is legal in both Colorado and Washington. It shouldn't be hard to attract talent to this city with a solid urban area, large airport, and nature galore. Though most people think of Denver as snowy, it has over 245 days of sunshine with some saying 300 if you include cloudy days but a peek of sun during the day. The cost of living is the highest out of my top 5 predictions, but it is still only 78% the cost of living when compared to Seattle. Meaning if you make $100k in seattle, you only need to make $78k in denver. Charlotte, NC. Large Airport: Check. Downtown: Check. Cost of living: Check. Willing to sell soul to land Amazon: Check. Like St. Louis, Charlotte might have a PR problem in that it really has no PR. Not good, not bad. Then you have the bathroom law fiasco which didnt help the city. One could argue that by moving to the "South" amazon is challenging themselves to grow market share in the historic Walmart Turf. If they can succeed, they can then use that for best practices for other countries. Review: Lets me honest, the most important factor in determining where amazon will move too... is my own bias PR rank. Answer: Very Background: The MTA sent out letters to some NYC employers asking them to let their employees have flexable work hours to avoid the "Summer of hell." http://nypost.com/2017/06/12/this-might-be-the-mtas-dumbest-solution-for-summer-commuters/ The idea is good, but the execution lacked hard evidence of when / where / why the employer should allow flexible schedules. I needed to brush up on my Six Sigma training and found a dataset that would be good practice on as well as provide an example of how data could help riders at least AVOID the peak of the hellish summer. What you see below is the:
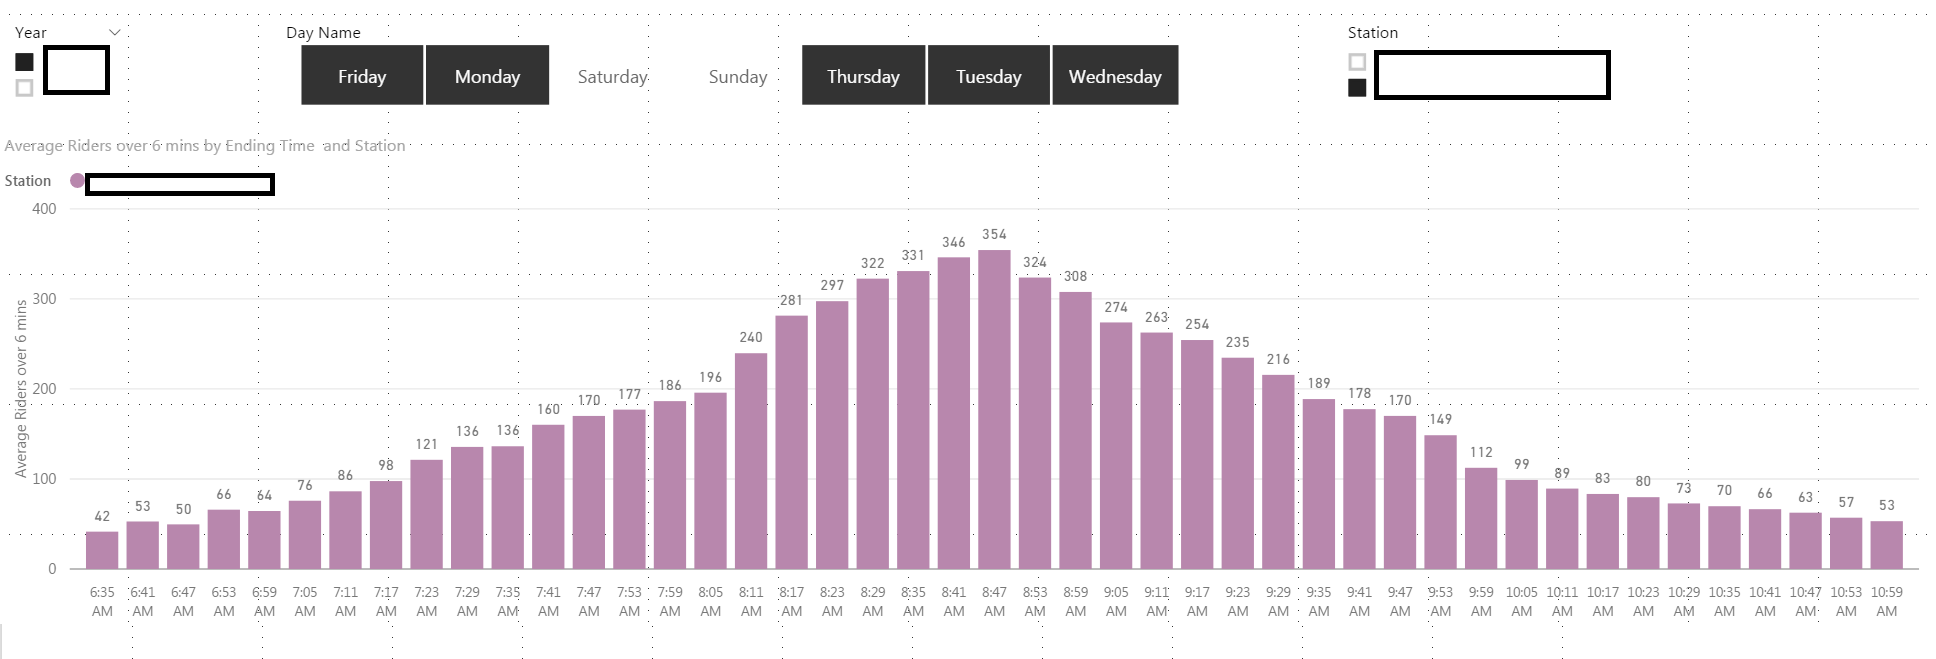 So this specific station on average has the highest number of people coming into the station at between 8:42AM and 8:47AM. Now the next question should be: "What is the distribution of riders for this specific period of time over the year being analyzed?" Is that specific 6 minute interval normal as well? Here it is: 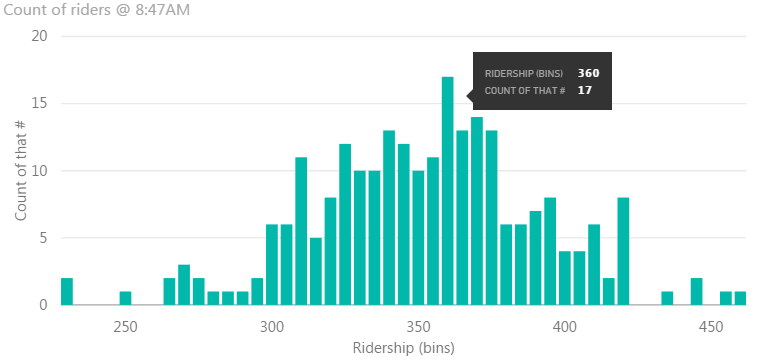 So over 240 data points for the year are recorded above. Remember, we are not including weekends and holidays which is why there is not 365 data points. We can see that 360 riders came through this 6 minute interval the most number of times at 17 times. Overall, I would say the data is pretty normal; most data points are clustering around the mean of 355.
So what can we now do with this? Well thanks to the normal data, we can utilize some basic statistics and figure out Variability and Confidence Intervals:
Next blog I will document what DAX formulas helped me accomplish this. Successful companies always have company values that guide their employees. I do wonder how many employees know their own employer's values? Sometimes it is not their fault as there might be just too many listed values to remember, values that were generated by a PR firm and have no relevance, or sadly have no explicit values to guide employees. I ran across Boston Consulting Group's values and liked the substance, but thought they could have done a much better job ORGANIZING them. Here is how they are published: https://www.bcg.com/about/mission/values.aspx 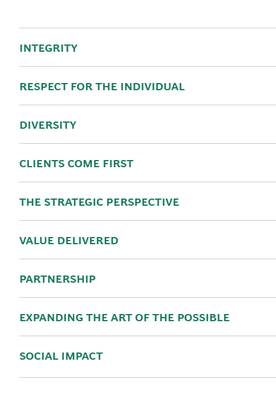 My thoughts:
I went ahead and took a shot on how they could organize it a little better along with my take away on what the overall value is stating. 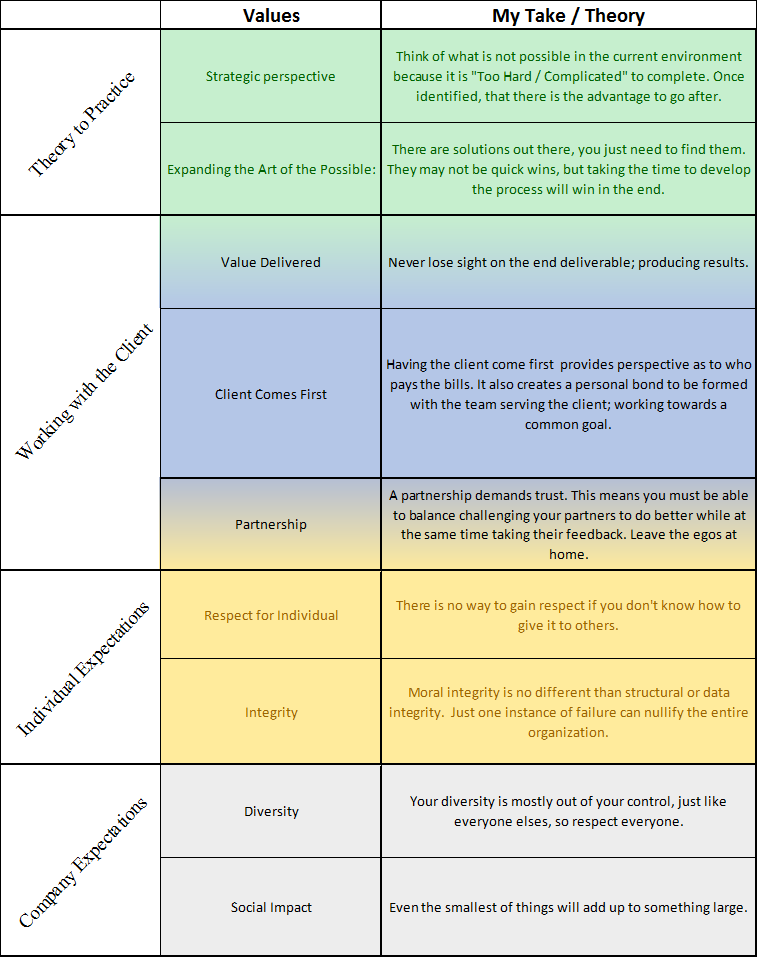 Fun Fact: The MTA will have over $100 BILLION liabilities by 2020, but you wont see that anywhere publicly posted. Their revenue from fares in 2016 totaled $8.5 Billion while taxes and subsidies accounted for $7 Billion in funds. Expenses were $15.7 Billion. So that means in 2016 the MTA broke even on the operations, not bad! 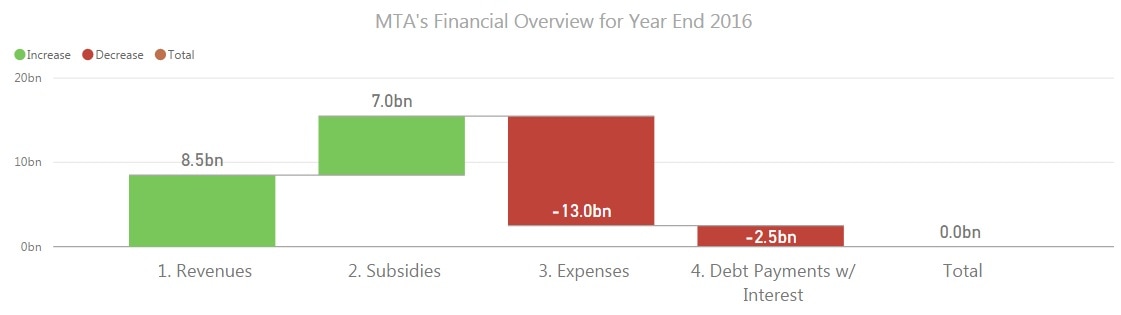 The problem with the income statement, is that it hides the costs that are to come in the future. The easily identifiable liabilities are plainly shown on the Balance Sheet: 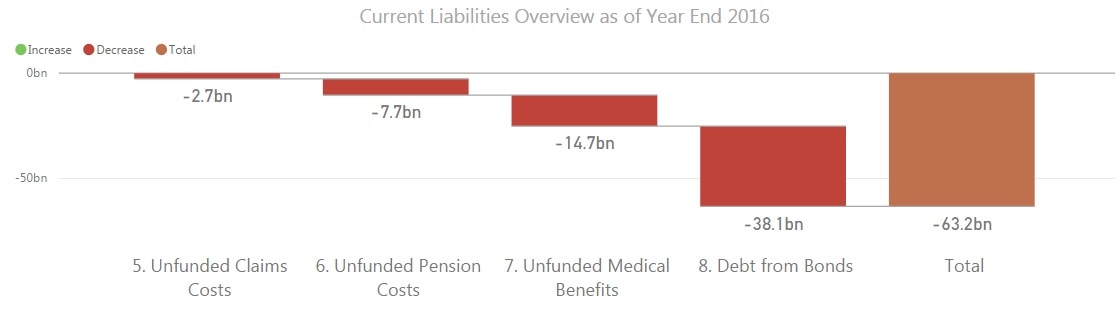 But you need to read the notes of the financial statements to see what else is out there, as well as look at the projected non-cash expenses that will be adding to the current liability amounts. 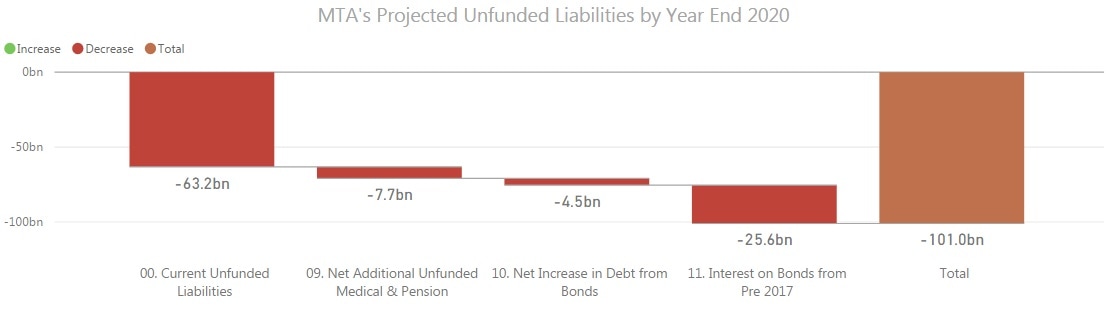 I am not saying this is devastating since a lot of these liabilities are due over the course of 30 years, but these will start creeping into the yearly operating costs and right now there is no funding to cover these expenses let alone the normal operating expense inflation/escalations. And of course, this all assume that after 2020 there will be no more increase in these liabilities which we all know will not be true. We also have to be aware of the current good times that the MTA is on which might come to end: 1. All time high ridership (fares) 2. All time high of NYC real estate sales tax collections (a big tax revenue source for MTA) 3. Very good stock market returns that are helping fund the underfunded pensions 4. Low interest rates on current bonds being issued. In the next couple of years something will have to happen: 1. Large increase in fares 2. Large increase in alternative funding (taxes, subsidies, federal support) 3. Large reorganization of payroll costs. (Eliminate non-performing or non-value added positions) 4. Large reform of Post Retirement Benefits All information contained here is publicly accessible:
web.mta.info/mta/news/books/docs/DRAFT%203rd%20Quarter%20MTA%20Consolidated%20Financial%20Statements.pdf web.mta.info/mta/news/books/pdf/170522_1230_Finance.pdf About to go camping in the Catskills in a month. Ticks and Lyme disease are already getting some big headlines that 2017 might be a record year. The CDC has some pretty good data to comb through: https://www.cdc.gov/lyme/stats/ They even have a cool map by year of confirmed cases. The problem is that you really cant see the progression over time. So i copied the maps and made a nice quick GIF!  Now we can easily see what has happened over the past 15 years. Seeing this... I have already bought some tick removal gear from amazon. :) T minus 30 days till camping!
My wife who is the Director of HR Strategy of a large CPG firm bought this book and I decided to give it a read as well. It is a funny book in that the knowledge I gained from it provided me with little value since I am not in that position to make organizational wide change, while for her, she can actually utilize it and implement the research into her organization. The summary of the research is that everyone knows Emotional Intelligence is a factor in employee performance, but almost no one tries to quantify it for employee evaluation. The research goes into details on the different types of Emotional Intelligence and how it benefits a company. One item that was never mentioned is once you identify highly emotional intelligent individuals…how does one compensate/reward them? If Jannice is the best manager in the world and everyone loves to work with her, but she is horrible at her job. Is that better than Joe who is a genius, but no one can stand working with him? Then about about Mikey who is perfectly average in both hard and soft skills and Mary who has the whole package. How do we reward these individuals? Here is my take: Utilize a non-linear evaluation matrix to assist in identifying and retaining the top talent and avoid rewarding bad behaviors. The following was created in PowerPoint: 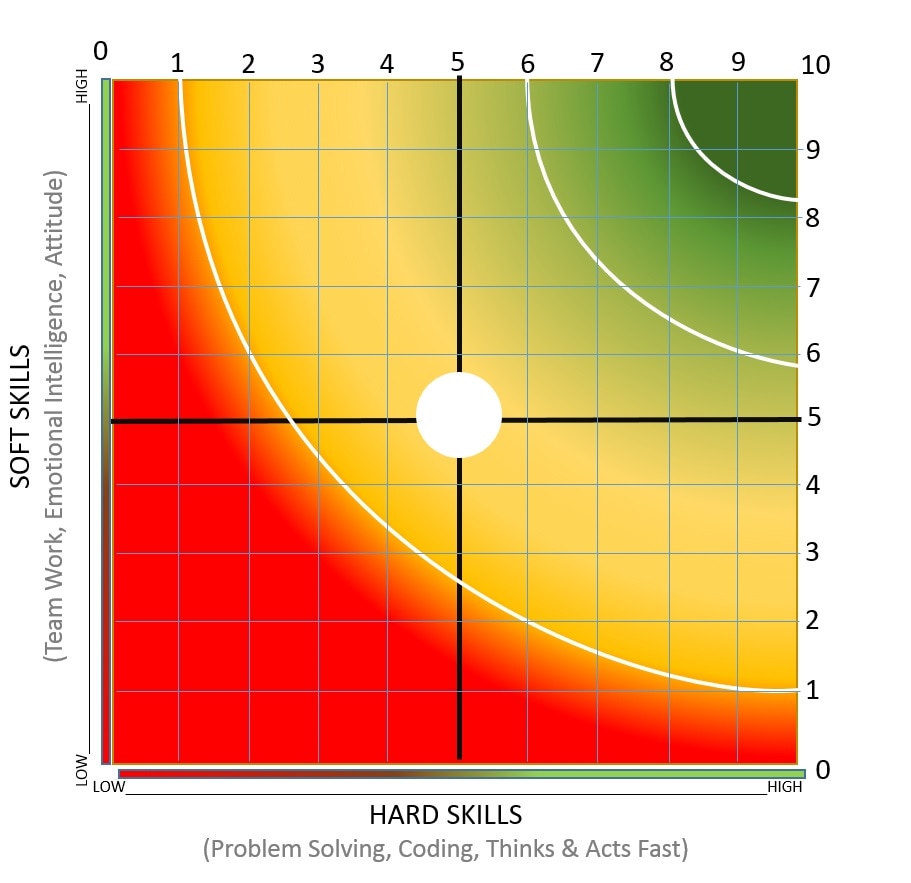 There are a few things to note on this hypothetical worksheet:
At the end of the day, the matrix is to elevate the importance of these soft skills and realize how hard it is to find someone that is both a master of hard and soft. And when one is found, you better hold on to them. 5 months ago I posted some statistics around the MTA Chairman / CEO turnover: www.adamflath.com/nerd-blog/mta-chairman-ceo-turnover I was excited because it seemed like Tom Prendergast was on course to be in position for close to 6+ years which would have provided some good continuity and theoretically complete strategic synergies across agencies.aa However, on Jan 1st, he announced his retirement. So here we go, restarting the counter for the new CEO. 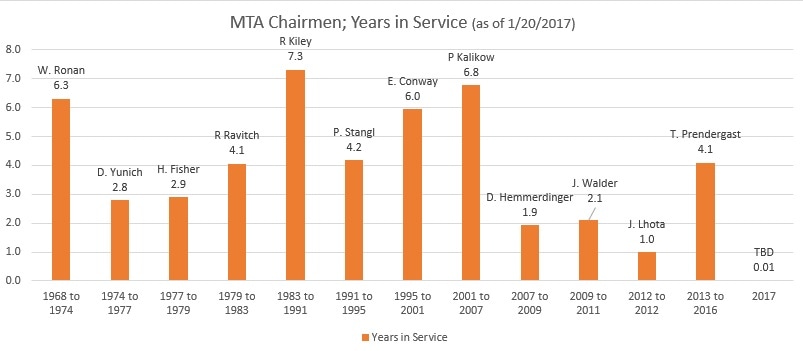 |
Fav ToolsPowerBI Archives
April 2018
Categories |
 RSS Feed