|
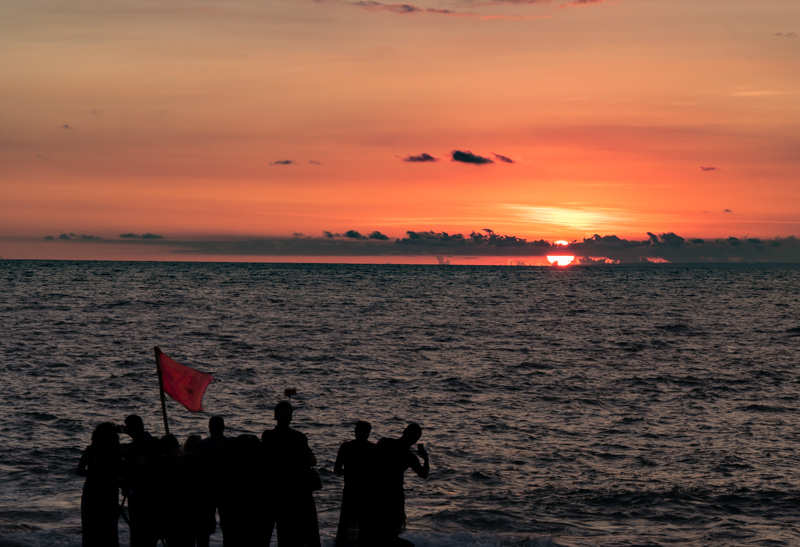
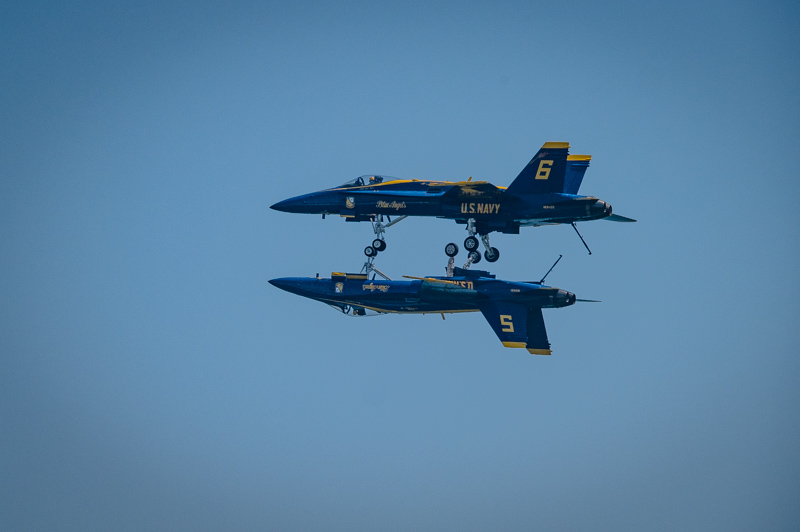
In case you have not heard, Panasonic recently announced an awesome upgrade to their great G7 camera; the new G85: https://www.dpreview.com/reviews/panasonic-lumix-dmc-g85-first-impressions-review I knew I wanted this, but that would mean I would have to sell my G7 which came with a 28-280mm lens. Amazon would buy back this camera kit for a very fair price and I would take those funds to buy the new G85 with the included 24-120 lens. The problem is that I LOVE the reach of the 280mm and not sure I could replace it with a lens that could only reach 120mm in distance. At the same a 24mm range for the new lens is a HUGE difference in getting a wider angle shot. Here are some examples of the different zoom ranges I took this past year: 28, 60, 280: The big question was: Do I really even use the lens at the zoomed in range? Let us Find out! In order to do so I went into the past year's worth of photos that are were marked as "5 Stars" meaning these photos would be printed out at the end of the year in my annual photo book. I then copied the metadata of these shots into an excel document. 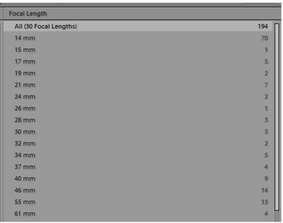 The next steps were to figure out what graphic representation can best convince me that I fully utilize my 28-280mm lens to it's full potential. 1. A very straight forward breakout of all of different focal lengths and the # of shots taken at each one. 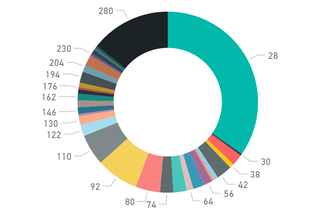 I can obviously see the two most used focal length were the very wide shot @ 28mm and the long shot @280mm. Overall this is too much information, lets group all the focal lengths into the potential new lens which would be 28-120mm and then the extra length of the current lens which would be 121-280mm. 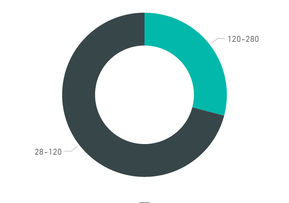 Much better. I can now easily see that 70% of my shots would be satisfied with the new lens. At the same time, I feel that I still do not have a sense of my shooting habits related to the different focal lengths; and this is where the Pareto comes in to the save the day: 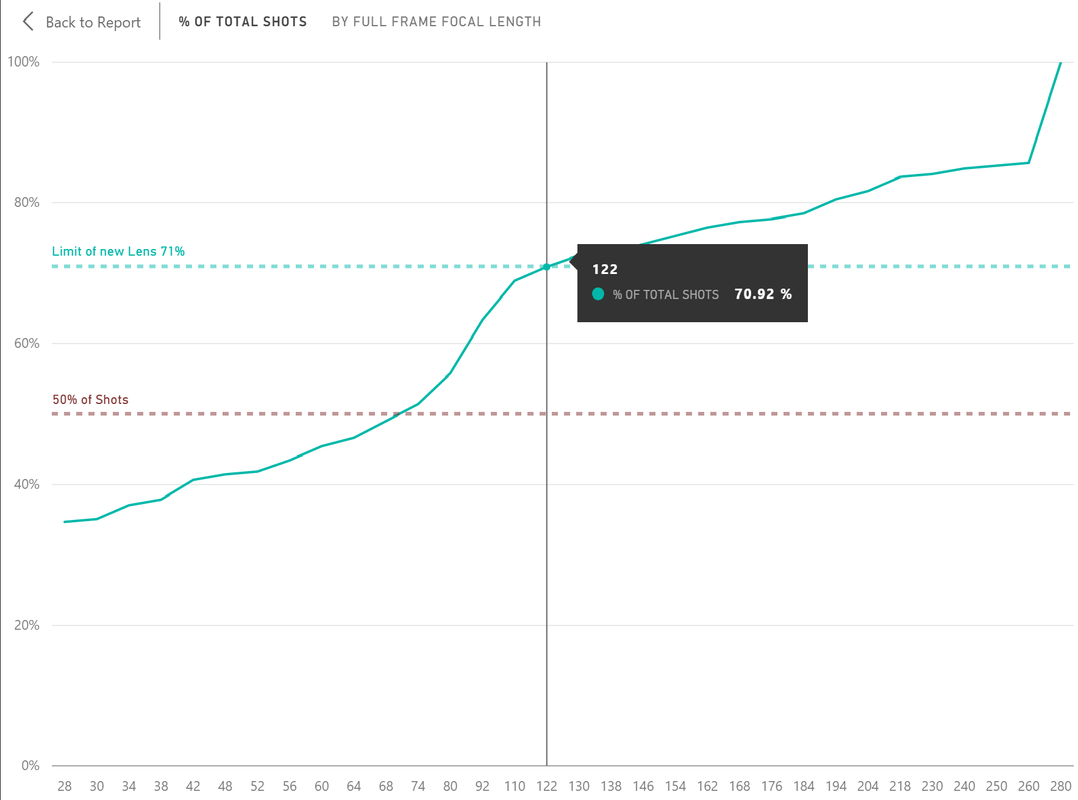 This graph really helps me understand the rate of photos I take relative to the maximum focal length I have available. After the data, I was curious to see which 5 star pictures were shot at the longest 280mm length. I cringed, because the majority of them were all AIRPLANE shot from two airshows I attended. DOH! I mean, the shots are great! But I really should have removed them since they are a subject I could care less about in getting "that shot." (Plus I have another camera system for that kind of work). Doing this exercise supplied me with a big surprise in that I fully thought most of my shooting was done at the long focal range. The data shows that since the majority of my shots were taken at the widest angle of 28mm, it questions how many shots could have been "better" or photos that were missed since I did not have a wider lens like a 24mm lens. So I sold the G7 and 28-280 lens to amazon, got the cash and now I am just waiting for the new camera and lens to be released! The Power(BI) of the Accumulative formulaOne of the primary formulas that was needed to create all of these graphs was the DAX accumulative formula which I have a separate posting on. This is one of the most basic formulas, yet by understanding the details, it helps unlock the mystery of the "evaluation contexts."
|
Fav ToolsPowerBI Archives
April 2018
Categories |

 RSS Feed